Essential Equity Analysis Indicators Every Pharma and Biotech Investor Should Know
Investors in pharmaceutical companies face a complex environment shaped by unique industry dynamics, where equity analysis relies on a blend of key indicators. These indicators include revenue growth, profitability, cash flow, burn rate, research and development spending, financial ratios, pipeline breadth, clinical trial success rates, regulatory milestones, competitive positioning, patent life, and risk assessment. Each indicator helps uncover the true value of biotech companies and supports strategic decision-making.
In the world of biotech valuation, understanding the probability of clinical success and appropriate discount rates becomes critical. The table below highlights how statistical benchmarks guide pharmaceutical company valuation and equity analysis techniques:
Metric | Value / Description |
|---|---|
Phase 1 Probability of Success | ~75% |
Phase 2 Probability of Success | ~50% |
Phase 3 Probability of Success | ~58% |
Early-stage Discount Rate | 40-50% (higher risk) |
Late-stage Discount Rate | 10-15% (lower risk) |
Median EV/Revenue Multiple (2023) | 12.97x (biotech industry median) |
Biotech companies with diversified pipelines and strong financial health often deliver greater value, as multiple assets reduce risk and enhance resilience. Equity analysis techniques in the biopharma sector depend on these key indicators to reveal value, manage risk, and illuminate the real drivers behind pharmaceutical company valuation. Informed analysis empowers investors to recognize enduring value in pharmaceutical and biotech companies, even amid uncertainty.
Key Takeaways
Focus on financial health by tracking revenue growth, profitability, cash flow, and R&D efficiency to identify resilient pharmaceutical companies.
Evaluate drug pipelines carefully, considering the number of candidates, their development stages, and clinical trial success rates to assess future value.
Understand key financial ratios like price-to-earnings, enterprise value-to-sales, and debt-to-equity to gauge company valuation and risk.
Consider regulatory milestones, market adoption challenges, and pricing power as critical factors that influence a company's commercial success.
Assess management quality, strategic partnerships, and innovation to uncover companies best positioned for long-term growth and value creation.
Financial Indicators in Equity Analysis
Revenue Growth and Profitability for Pharmaceutical Companies
Revenue growth stands as a primary signal of strength for pharmaceutical companies. Investors often look for consistent increases in revenue, as this trend suggests robust demand for products and successful commercialization strategies. Over recent years, major pharmaceutical companies have demonstrated steady revenue growth, supported by nearly 10% annual increases in research and development spending since 2019. This investment has fueled record levels of drug development and pipeline expansion. Companies now pursue both traditional modalities, such as antibodies and small molecules, and innovative approaches like cell and gene therapies. These efforts create diversified revenue streams and reduce reliance on any single product.
Profitability remains a central concern for equity analysis. The average return on equity (ROE) in the pharmaceutical sector hovers around 10.49%, reflecting typical profitability levels. However, some companies, such as Eli Lilly, have achieved much higher ROE figures—up to 74%—by leveraging debt to amplify returns. Investors use profitability metrics to compare companies and assess operational efficiency. High profitability often signals effective cost management, pricing power, and successful product launches. The following table summarizes key financial indicators that guide equity analysis techniques in the sector:
Financial Indicator / Metric | Value / Finding | Explanation |
|---|---|---|
Return on Equity (ROE) | Average ~10.49% | Indicates average profitability in the pharmaceutical sector. |
Eli Lilly ROE | 74% | Example of high ROE driven by leverage. |
Eli Lilly Debt-to-Equity | 2.18 | Shows leverage impact on returns. |
Revenue Variability Explained (R²) | 0.764 (76%) | Predictive econometric model explains 76% of revenue variability using financial, regulatory, and pipeline data. |
Model Adjusted R² | 0.741 | Indicates robustness of the revenue prediction model. |
Investors should note that machine learning models, such as neural networks and Extreme Gradient Boost, now play a growing role in forecasting demand and sales, further enhancing the accuracy of revenue projections.
Cash Flow, Burn Rate, and Mid-cap Pharmaceutical Companies
Cash flow analysis provides a window into the financial health of pharmaceutical companies, especially those in the mid-cap segment. These companies often face unique challenges as they balance ambitious growth plans with the realities of limited resources. Positive cash flow signals that a company can fund operations, invest in new projects, and weather unexpected setbacks. For mid-cap pharmaceutical companies, cash flow management becomes even more critical, as these firms typically operate with tighter margins and greater exposure to market volatility.
Burn rate, or the speed at which a company spends its available cash, serves as a vital metric for investors. A high burn rate may indicate aggressive investment in pipeline development, but it can also signal risk if not matched by incoming revenue or external funding. Mid-cap pharmaceutical companies must carefully monitor their burn rates to avoid liquidity crises. Investors often compare key ratios—such as price-to-earnings (P/E), price-to-book (P/B), debt-to-equity, and EBITDA multiples—to assess growth potential and risk. The table below highlights essential metrics for evaluating mid-cap pharmaceutical companies:
Equity Analysis Metric / Method | Description / Example | Importance in Pharma Equity Analysis |
|---|---|---|
Financial Ratios (P/E, P/B, Debt-to-Equity) | Assess profitability, liquidity, and leverage. | Key for evaluating financial health and risk in mid-cap pharma. |
Revenue Growth & Profit Margins | Indicators of scaling ability and operational efficiency. | Critical for assessing growth potential. |
EBITDA Multiples & Cash Flow | Used for valuation and liquidity assessment. | Important for funding R&D and managing debt. |
Pipeline Valuation | Evaluation of drug candidates and clinical trial success rates. | Influences future revenue and stock performance. |
Mid-cap pharmaceutical companies that maintain healthy cash flow and moderate burn rates often attract investor interest, as these traits suggest resilience and the ability to capitalize on emerging opportunities.
R&D Spending, Efficiency, and Impact on Investors
Investing in R&D forms the backbone of long-term value creation for pharmaceutical companies. Sustained increases in R&D spending have driven innovation, with the average compound annual growth rate of R&D expenditure reaching 6% from 2001 to 2020. The average R&D investment per company climbed to $6.7 billion in 2020, reflecting the sector’s commitment to scientific advancement. However, the efficiency of this spending varies widely. The median R&D cost per drug approval stands at $2.63 billion, but companies that improve phase II success rates can reduce this figure by hundreds of millions.
Large pharmaceutical companies have maintained stable R&D intensity, with a mean R&D-to-sales ratio of approximately 18.4%. In contrast, small and mid-cap pharmaceutical companies have increased their R&D intensity by 34% between 2015 and 2019. Notably, these smaller firms contributed to 64% of new molecular entity approvals in 2018, underscoring their role as engines of innovation. Despite these achievements, nearly half of big pharma companies report negative R&D productivity, often compensating through mergers and acquisitions.
Investors should recognize that improvements in R&D efficiency can yield significant cost savings—sometimes exceeding $1 billion per approval—and directly enhance profitability and equity value.
As the pharmaceutical landscape evolves, companies that optimize R&D spending and efficiency will likely deliver superior returns. Equity analysis techniques that incorporate these metrics provide investors with a clearer view of future growth prospects and the sustainability of profitability.
Reflective Takeaway:
Financial indicators serve as the compass for investors navigating the complex world of pharmaceutical companies. By focusing on revenue growth, profitability, cash flow, and R&D efficiency, investors can identify companies with the resilience and innovation needed to thrive. Mid-cap pharmaceutical companies, in particular, offer unique opportunities and risks, making careful equity analysis essential. As the industry continues to evolve, those who master these indicators will remain best positioned to uncover enduring value and drive strategic growth.
Key Financial Ratios in Equity Analysis (P/E, EV/Sales, Debt-to-Equity)
Key financial ratios serve as the backbone of equity analysis in the pharmaceutical and biotech sectors. Investors rely on these metrics to decode the financial health, operational efficiency, and growth prospects of companies navigating complex markets. Each ratio offers a unique lens, revealing different aspects of a company’s performance and risk profile. Understanding how to interpret these ratios within the context of the industry’s capital-intensive nature and long development cycles is essential for any investor seeking clarity and confidence.
1. Price-to-Earnings (P/E) Ratio
The price-to-earnings ratio stands as one of the most recognized profitability ratios in equity analysis. This metric compares a company’s current share price to its earnings per share, providing a snapshot of how much investors are willing to pay for each dollar of profit. In the pharmaceutical industry, the P/E ratio often fluctuates due to the unpredictable nature of drug development and regulatory approvals. High P/E ratios may signal strong growth expectations, especially for companies with promising pipelines. However, investors must exercise caution, as earnings can swing dramatically with the success or failure of a single product.
2. Enterprise Value-to-Sales (EV/Sales) Ratio
The EV/Sales ratio has gained prominence as a key financial ratio for evaluating pharmaceutical companies, particularly those in early or high-growth stages. This ratio divides a company’s enterprise value—which includes market capitalization and debt—by its total revenue. Unlike the P/E ratio, EV/Sales does not depend on profitability, making it especially useful for companies that reinvest heavily in research and development or have yet to achieve consistent profits.
Investors often turn to the EV/Sales ratio when analyzing growth companies with significant capital expenditures and long product development timelines. High EV/Sales ratios frequently appear in early-stage firms, reflecting anticipated future revenue streams. Mature companies tend to display more moderate ratios, aligning with established sales and lower growth expectations. Context matters: comparing EV/Sales across industry peers and tracking trends over time provides a more meaningful analysis than relying on a single data point.
3. Debt-to-Equity Ratio
The debt-to-equity ratio measures a company’s financial leverage by comparing total debt to shareholders’ equity. This key financial ratio reveals how much a company relies on borrowed funds to fuel growth and operations. In the pharmaceutical sector, debt can amplify returns, as seen in companies like Eli Lilly, which reported a debt-to-equity ratio of 2.18 and a return on equity of 74%. While leverage can boost profitability, it also introduces risk. Excessive debt may strain a company’s ability to invest in new products or weather market downturns.
Prudent debt management remains critical for long-term viability. Investors should assess whether high returns stem from genuine operational efficiency or from aggressive leverage strategies. Sustainable growth often depends on a balanced approach to financing.
4. Interpreting Key Financial Ratios in Context
No single ratio tells the whole story. Investors achieve the most accurate equity analysis by examining key financial ratios together and comparing them to industry benchmarks. The table below summarizes the most relevant ratios and their significance in pharmaceutical equity analysis:
Ratio / Benchmark | Description | Typical Value / Example | Significance in Pharmaceutical Equity Analysis |
|---|---|---|---|
Return on Equity (ROE) | Measures profitability relative to shareholders' equity. | Industry average ~10.49%; Eli Lilly: 74% | Indicates how effectively equity capital is used; high ROE often linked to profitability but may be influenced by leverage. |
Debt-to-Equity Ratio | Measures financial leverage by comparing total debt to shareholders' equity. | Eli Lilly: 2.18 | Shows extent of debt used to fuel returns; important to assess risk and sustainability of high ROE driven by leverage. |
EV/Sales Ratio | Enterprise value divided by total sales; used to value growth companies including pharma firms. | Varies by company maturity and growth stage | Helps assess valuation relative to sales; higher ratios common in growth phases; must be interpreted in industry context. |
Price-to-Earnings (P/E) | Compares share price to earnings per share. | Varies widely | Useful for mature companies; less reliable for firms with volatile or negative earnings. |
5. Practical Application for Investors
Investors who master the use of key financial ratios gain a sharper perspective on both risk and opportunity. For example, a company with a high return on equity and moderate debt-to-equity ratio may signal efficient use of capital and sustainable profitability. Conversely, a high EV/Sales ratio in an early-stage biotech firm could indicate strong growth potential, but it also warrants scrutiny of the underlying revenue assumptions and pipeline risks.
A second table below illustrates how these ratios interact in real-world scenarios:
Company Type | P/E Ratio | EV/Sales Ratio | Debt-to-Equity | Return on Equity | Profitability Outlook |
|---|---|---|---|---|---|
Mature Pharma | 15-20 | 3-5 | 0.5-1.5 | 10-20% | Stable, driven by core drugs |
High-Growth Biotech | N/A or 50+ | 10-20 | 1.5-3.0 | N/A or 20%+ | Dependent on pipeline |
Leveraged Pharma | 10-15 | 4-8 | 2.0+ | 30%+ | High, but riskier |
Note: N/A indicates negative or negligible earnings, common in early-stage biotech.
Reflective Takeaway
Key financial ratios act as a compass for investors navigating the intricate landscape of pharmaceutical equity analysis. By combining insights from profitability ratios, return on equity, and leverage metrics, investors can distinguish between sustainable growth and fleeting success. The most effective analysis always considers industry context, company maturity, and the interplay between revenue, profitability, and risk. Those who approach these ratios with curiosity and discipline will uncover deeper truths about value creation in the life sciences sector.
Pipeline Valuation and Clinical Development Metrics

Pipeline Stages and Breadth in Pharmaceutical Companies
Pipeline evaluation stands at the heart of biotech valuation and pharmaceutical company valuation. For pharmaceutical companies, the breadth and depth of their drug candidates often determine their future value and resilience. A robust pipeline, spanning multiple therapeutic areas and development stages, signals not only innovation but also strategic foresight. Companies with a diverse array of drug candidates can better withstand setbacks, as success in one area may offset challenges in another.
A comprehensive study of 11 large multinational biopharma firms from 2000 to 2012 revealed a direct link between pipeline valuation and superior performance metrics. Firms with higher pipeline value as a percentage of their total valuation consistently outperformed peers in revenue growth, net income, and market multiples. This finding underscores the importance of pipeline evaluation in equity analysis, as a well-valued pipeline correlates with stronger financial outcomes and greater investor confidence.
The value of each drug candidate evolves as it progresses through development. Early-stage assets in the pre-clinical phase carry the highest risk and contribute less to overall valuation, yet they provide essential optionality and sustain long-term pipeline potential. As drug candidates advance, their probability of success increases, and so does their contribution to company value. The following table illustrates how the probability of success and valuation impact shift across development stages:
Development Stage | Probability of Success (%) | Valuation Impact Description |
|---|---|---|
Pre-Clinical | 1-10 | Highest risk stage; steep risk adjustment; minimal individual value but important for optionality and pipeline sustainability |
Phase I Clinical Trials | 10-20 | Safety assessment stage; significant value inflection upon success; risk-adjusted net present value (rNPV) increases substantially |
Phase II Clinical Trials | 20-40 | Efficacy and safety expansion; moderate risk; value increases with positive efficacy signals |
Phase III Clinical Trials | 50-70 | Definitive efficacy data; substantially higher approval probability; dramatic value increase compared to Phase II |
Regulatory Review | 80-90+ | Lowest risk; valuation focuses on market access and launch considerations rather than development risk |
Pipeline evaluation, therefore, requires a nuanced understanding of both the number and stage of drug candidates. Biotech companies with a balanced mix of early- and late-stage assets often command higher valuations, as they offer both near-term revenue potential and long-term growth opportunities. This dynamic makes pipeline breadth a critical driver of value in both biotech and pharmaceutical sectors.
Clinical Trial Success Rates and Investor Implications
Clinical trial success rates serve as a cornerstone for biotech valuation and pipeline evaluation. Investors closely monitor these rates, as each successful transition from one phase to the next significantly enhances the value of drug candidates and, by extension, the entire company. The journey from pre-clinical research to regulatory approval is fraught with risk, but each milestone achieved reduces uncertainty and increases expected returns.
Statistical analysis demonstrates that the probability of FDA approval rises sharply as drug candidates progress through clinical stages. For example, pre-clinical assets have about a 4% chance of approval, while those in Phase III reach approximately 56%. This progression is visually captured in the chart below:

The impact of clinical trial success rates on value is profound. Investors in biopharma companies with biologic or gene therapy lead products can expect capital growth of 1.8 times from Phase 1 to FDA approval, translating to annual returns of 16% after accounting for failures. Small-molecule drug developers fare even better, with capital growth of 3.6 times and annual returns of 19%. Oncology-focused biotech companies often achieve higher valuations during Phase 2 and deliver superior simulated returns compared to those targeting central nervous system disorders.
Industry-wide data from over 9,200 compounds between 1996 and 2014 reveal that partnerships, experienced sponsors, and a focus on high-probability drug types—such as orphan drugs and immuno-oncology—boost clinical trial success rates. These factors, in turn, enhance company value and investor returns. Automated algorithms analyzing more than 400,000 clinical trial entries now provide robust estimates of phase transition probabilities, enabling more accurate risk assessment and valuation for both biotech companies and investors.
The table below summarizes the probability of FDA approval at each development stage, reinforcing the critical role of clinical trial success in pipeline evaluation and biotech valuation:
Development Stage | Probability of FDA Approval (%) |
|---|---|
Pre-Clinical | ~4 |
Phase I | ~12 |
Phase II | ~20 |
Phase III | ~56 |
As drug candidates advance, their value increases exponentially, making clinical trial success rates a vital metric for both pipeline evaluation and overall pharmaceutical company valuation.
Regulatory Milestones and Approvals in Equity Analysis
Regulatory milestones represent pivotal moments in the lifecycle of drug candidates, shaping both biotech valuation and the broader outlook for pharmaceutical companies. The regulatory approval process remains lengthy and unpredictable, introducing risks of delays that can erode value by reducing revenue windows and intensifying competition. Regulatory agencies may require additional studies or impose marketing restrictions, further influencing the value of drug candidates and the companies developing them.
Successful navigation of regulatory hurdles can unlock substantial value. Market exclusivity, patent protection, and pricing power often follow regulatory approval, driving revenue growth and enhancing company valuation. Innovation in novel therapies, especially those addressing unmet medical needs, attracts investor interest and differentiates biotech companies in crowded markets. The market potential for new drugs, such as those targeting cardiovascular diseases, continues to shape the equity outlook for the entire sector.
Expedited regulatory programs—such as breakthrough designation, accelerated approval, priority review, and fast track status—signal a drug’s potential and unmet medical need. These designations accelerate development timelines and reflect regulatory confidence, often boosting investor sentiment and competitive positioning.
Media narratives around drug approvals and clinical trial outcomes also play a significant role. Positive coverage of successful trials can elevate stock prices and market valuation, while negative reports may have the opposite effect. Drugs that receive extensive media attention during the approval process often enjoy greater market success, highlighting the importance of strategic communication for biotech companies.
Partnerships with other entities help mitigate regulatory risks and enhance the rewards of successful development. Competitor analysis, including tracking approval timelines, label negotiations, and post-approval commitments, enables companies and investors to forecast competitive landscapes and adjust valuations accordingly. Understanding these regulatory milestones and strategies is essential for effective pipeline evaluation and for maximizing value in both biotech and pharmaceutical sectors.
Reflective Takeaway:
Pipeline evaluation and clinical development metrics form the backbone of biotech valuation and pharmaceutical company valuation. The progression of drug candidates through development stages, the probability of clinical success, and the achievement of regulatory milestones all drive value creation. Investors who master these metrics gain a deeper understanding of pipeline potential and the forces shaping the future of pharmaceutical companies. In a landscape defined by innovation and uncertainty, those who look beyond the surface and evaluate the true value of biotech companies will remain best positioned to recognize enduring opportunity.
Time to Market and Commercialization Potential
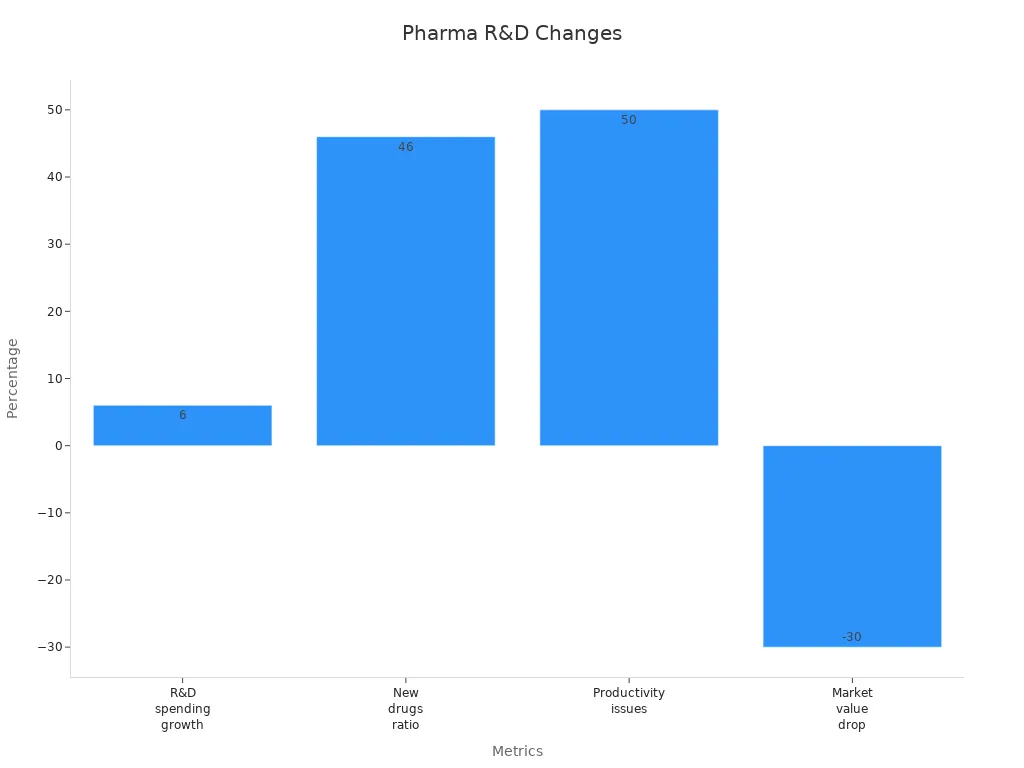
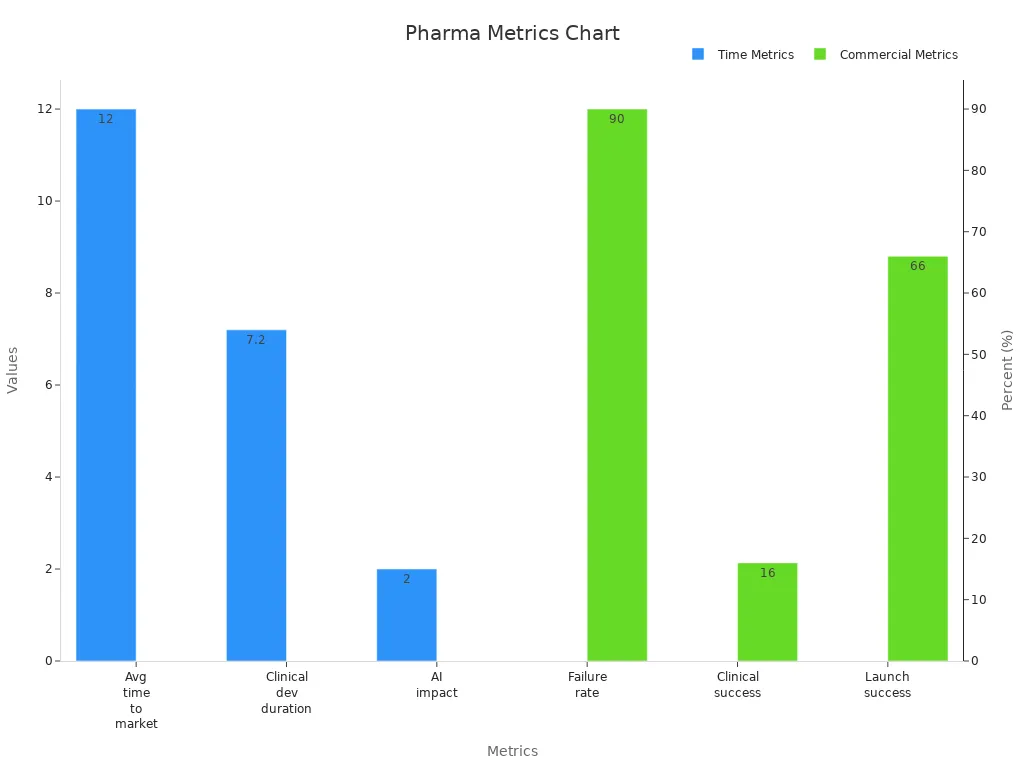
Time to market stands as a defining factor in the pharmaceutical and biotech sectors. Investors and industry leaders alike recognize that the speed at which a company brings a new therapy from discovery to commercial launch can determine both competitive advantage and long-term value. The journey from initial research to patient access remains arduous, marked by scientific uncertainty, regulatory scrutiny, and significant capital investment.
The average drug development process stretches across more than a decade. Most new therapies require approximately 12 years to progress from early discovery through clinical trials and regulatory review before reaching the market. Clinical development alone consumes about 7.2 years, reflecting the complexity of human studies and the rigorous standards set by global health authorities. The financial stakes are equally high. Recent estimates place the total R&D cost per approved drug between $1.1 billion and $4.4 billion, a figure that continues to rise as therapies become more specialized and personalized.
Metric | Value/Description |
|---|---|
Average time to market | Approximately 12 years overall |
Clinical development duration | About 7.2 years |
Failure rate | Up to 90% |
R&D costs | $1.1B–$4.4B per approved drug |
Clinical success rate | Around 16% |
Commercial launch success | ~66% of drugs meet or exceed analyst expectations |
AI impact | Potential to reduce development time by up to 2 years |
The high failure rate—reaching up to 90%—underscores the inherent risk in drug development. Only about 16% of candidates entering clinical trials ultimately achieve regulatory approval. Despite these odds, companies that successfully navigate this process often unlock substantial commercial rewards. Approximately two-thirds of newly launched drugs meet or surpass analyst expectations, a testament to the value of rigorous pipeline evaluation and strategic market planning.
Several factors influence the time to market and the likelihood of commercial success. Expedited regulatory pathways, such as orphan drug designations and breakthrough therapy status, can accelerate approval timelines for therapies addressing unmet medical needs. These programs not only shorten development cycles but also enhance a company’s ability to capture market share ahead of competitors. Strategic alliances and partnerships further support commercialization by providing access to specialized expertise, distribution networks, and additional capital.
The rise of artificial intelligence (AI) marks a transformative shift in the industry’s approach to drug discovery and development. AI investment in drug discovery is projected to reach $3 billion by 2025, reflecting growing confidence in its potential to streamline R&D processes. The number of AI-driven alliances surged from just 10 in 2015 to over 100 by 2021, signaling widespread adoption across the sector. Companies like Amgen anticipate that AI will significantly shorten clinical trial durations, potentially reducing overall development time by up to two years. This acceleration not only lowers costs but also increases the probability of commercial success by enabling faster responses to emerging health needs.
Key commercialization metrics and trends:
AI-driven drug discovery alliances have grown tenfold since 2015.
Typical drug development still takes 12–18 years, but AI may cut this by up to two years.
R&D costs per drug approval continue to rise, now reaching as high as $4.4 billion.
Expedited approvals and orphan drug designations remain critical for reducing time to market.
Commercialization potential depends not only on speed but also on strategic execution. Companies must align product launches with robust market access strategies, effective pricing, and reimbursement planning. The ability to educate healthcare providers, engage patient communities, and navigate complex regulatory environments often separates market leaders from those who struggle to gain traction.
Commercialization KPI | Description | Strategic Importance |
|---|---|---|
Time to market | Duration from discovery to launch | Determines competitive positioning |
Cost per drug | Total R&D expenditure per approved therapy | Impacts profitability and ROI |
Number of successful trials | Clinical programs reaching endpoints | Drives investor confidence |
Launch success rate | Percentage of drugs meeting/exceeding forecasts | Reflects market readiness and planning |
Companies that consistently reduce time to market and execute successful launches demonstrate adaptability and strategic foresight. These traits often signal strong management and a culture of innovation—qualities that investors value highly.
Reflective Takeaway:
Time to market and commercialization potential shape the destiny of pharmaceutical and biotech companies. Those who master the art of accelerating development, leveraging new technologies, and executing thoughtful launch strategies stand poised to capture both market share and investor confidence. As AI and expedited regulatory pathways reshape the landscape, the most resilient companies will blend scientific rigor with business agility. For investors, understanding these dynamics offers a window into the future of healthcare innovation and the enduring value of strategic equity analysis.
Market and Competitive Positioning for Investors

Market Size, Growth Potential, and Pipeline Valuation
Market positioning in the pharmaceutical and biotech sectors depends on a deep understanding of addressable market size, growth potential, and the strategic value of robust pipelines. The global pharmaceutical market is projected to expand from $1,645.75 billion in 2024 to $2,350.43 billion by 2030, reflecting a compound annual growth rate (CAGR) of 6.12%. This growth is fueled by advances in biologics, personalized medicine, and RNAi-based therapeutics, as well as increasing demand for patient-centric solutions and expedited regulatory pathways. Major pharmaceutical companies such as Johnson & Johnson, Merck, and Eli Lilly drive this expansion through significant R&D investments and strategic collaborations. The U.S. market alone accounted for $602.19 billion in 2023, representing a substantial share of global value and highlighting the importance of market access and innovation.
Metric | Value (USD Billion) | Additional Info |
|---|---|---|
Global Market Size 2023 | Baseline year data | |
Projected Market Size 2032 | 2,646.93 | Forecasted growth endpoint |
CAGR (2025-2032) | 6.12% | Forecast period |
Investors often assess pipeline valuation by examining the breadth and depth of drug candidates, as a diverse pipeline can unlock new revenue streams and mitigate risk. Biotech companies with strong pipelines and innovative assets consistently deliver greater value, especially when they target high-growth therapeutic areas and leverage emerging technologies.
Patent Life, Exclusivity, and Competitive Advantage
Patent life and exclusivity periods form the backbone of competitive advantage for pharmaceutical companies and biotech firms. Patent litigation under the Hatch-Waxman Act allows generic challengers to contest patents, yet innovator companies defend their positions vigorously to maintain exclusivity. The first successful generic challenger receives a 180-day exclusivity period, shaping the competitive landscape and incentivizing early challenges. Innovator companies often employ strategies such as authorized generics and 'evergreening'—filing secondary patents on formulations or processes—to extend exclusivity beyond the original patent term. These tactics create a web of patents that can effectively block generic entry and prolong market value.
Data exclusivity, which begins upon FDA approval, cannot be legally challenged and further delays generic competition. This extension of exclusivity increases profits and incentivizes pharmaceutical innovation. Empirical studies show that larger market size and longer exclusivity periods correlate with increased drug approvals and higher innovation rates. For example, a 1% increase in potential market size leads to a 3-4% rise in new drug entries, underscoring the direct link between exclusivity and value creation for both pharmaceutical and biotech companies.
Competitive Landscape and Differentiation in Pharmaceutical Companies
The competitive landscape in the biopharma sector evolves rapidly, shaped by product portfolio assessments, scenario-based analytics, and continuous monitoring of competitor strategies. Leading pharmaceutical companies differentiate themselves through portfolio rationalization, strategic positioning, and commercial capabilities that go beyond simple product listings. Companies use advanced analytics to identify market opportunities, defend against patent cliffs, and adapt to information overload. This multidimensional approach enables them to anticipate shifts in digital therapeutics, precision medicine, and emerging markets.
Key elements of competitive intelligence include:
Clinical trial monitoring and regulatory submissions
Product portfolio and sales tracking
Competitor profiling and deal analysis
Patent filings and pipeline development timelines
Regulatory strategy evaluation and emerging market intelligence
Biotech companies that excel in these areas gain a clearer view of market dynamics and can position themselves to capture greater value. The table below summarizes supplemental data sources that validate competitive positioning:
Data Source | Strategic Insight Provided |
|---|---|
Clinical trial intelligence | Anticipates pipeline impacts |
Product portfolio assessment | Reveals competitor strengths |
Patent filings and analysis | Detects innovation trends |
Regulatory submissions | Informs on approval strategies |
Emerging market competition | Tracks new business models |
Companies that master competitive intelligence and differentiation strategies consistently unlock new value, adapt to evolving market forces, and sustain leadership in the biopharma landscape.
Reflective Takeaway:
Market and competitive positioning remain central to long-term value creation for pharmaceutical and biotech companies. Those who understand the interplay between market size, exclusivity, and competitive intelligence can better navigate the complexities of the sector and identify enduring opportunities for growth.
Pricing Power and Reimbursement Outlook
Pricing power in the pharmaceutical sector shapes both revenue potential and long-term sustainability. Companies often rely on value-based pricing frameworks, which anchor drug prices to clinical and economic evidence. Health technology assessments (HTAs) play a central role, as they evaluate therapeutic value and guide negotiations with payers. These assessments do not set prices directly but influence outcomes by highlighting the benefits and cost-effectiveness of new therapies. Each country applies its own approach—Germany emphasizes clinical benefit, while Sweden and England focus on cost-effectiveness. This leads to jurisdiction-specific prices and creates a complex landscape for global market access.
Health economics and outcomes research (HEOR) supports these negotiations by quantifying treatment costs relative to patient outcomes. Pharmaceutical companies use these insights to design proactive pricing strategies, including risk-sharing agreements that align payment with real-world performance. Early involvement of pricing and market access teams, especially at the C-suite level, often correlates with higher profitability and smoother commercialization. Investors pay close attention to these strategies, as they directly affect the likelihood of maintaining price premiums and securing favorable reimbursement.
The market environment continues to evolve. In the United States, payer consolidation has increased dramatically, with the four largest payers now covering 85% of the market. This consolidation strengthens payer negotiating power and often results in greater pressure on drug prices. In Europe, new products may face discounts of 70% to 85% off US list prices after lengthy negotiations, sometimes lasting up to two years post-approval. These factors introduce significant revenue risk and can delay market entry, impacting company valuations and investor confidence.
Metric/Statistic | Description | Impact on Investor Assessment |
|---|---|---|
Probability of Pricing and Access Success (PPAS) | Composite metric evaluating risk based on therapeutic area, region, timing, competition, payer priorities, and asset differentiation | Quantifies likelihood of price premiums and formulary access |
Discounts in Europe | New products may face 70%-85% discounts off US list prices | Indicates revenue risk and pricing pressure |
US Payer Consolidation | Four largest payers cover 85% of the market | Raises risk of price concessions and impacts revenue forecasts |
Negotiation Duration in Europe | Up to two years post-EMA approval | Delays market access and revenue realization |
Pharmaceutical companies that integrate pricing and reimbursement considerations early in development often achieve better commercial outcomes. They anticipate payer concerns, adapt to local definitions of value, and use advanced analytics to support negotiations. For investors, understanding these dynamics provides a clearer view of commercial risks and the potential for sustainable growth.
Reflective Takeaway:
Pricing power and reimbursement outlook remain pivotal in shaping the commercial trajectory of pharmaceutical innovations. Companies that master these complexities—balancing evidence-based value with payer expectations—position themselves for resilience in a challenging market. Investors who grasp these nuances gain deeper insight into the forces that drive long-term value and adaptability in the life sciences sector.
Risk Assessment in Equity Analysis
Regulatory Risks for Investors
Regulatory risk stands as one of the most significant challenges for investors in pharmaceutical companies. The industry faces a complex regulatory environment that evolves rapidly, requiring companies to shift from reactive compliance to proactive, data-driven risk management strategies. Investors must recognize that regulatory risk extends beyond simple approval delays. It encompasses global regulatory differences, fragmented data, quality and safety demands, cost pressures, cybersecurity threats, and the relentless pace of innovation.
A comprehensive event study quantifies the economic impact of regulatory shocks on pharmaceutical firms. On average, a single adverse regulatory event results in losses ranging from $569 million to $882 million. These losses include approximately $186 million in unexpected revenue declines from affected products over their remaining patent life, with an additional $383 million to $696 million attributed to reduced future investment in innovation. Expedited drug approvals, while offering faster market access, also increase the risk of regulatory relabeling, creating a trade-off between speed and long-term innovation.
Key regulatory risk factors:
Navigating global regulatory frameworks
Managing fragmented compliance data
Addressing quality and safety imperatives
Responding to cybersecurity threats
Balancing accelerated innovation cycles
Investors who understand the multifaceted nature of regulatory risk can better anticipate its impact on company valuation and strategic direction.
Clinical and Scientific Risks in Pharmaceutical Companies
Clinical and scientific risk shapes the core of equity analysis in the pharmaceutical sector. The development stage of a lead product drives valuation, with early-stage assets carrying higher risk and uncertainty but also the potential for greater returns. Orphan-designated products, which benefit from lower attrition rates, market exclusivity, and expedited approval, show significantly higher late-stage valuations and annual returns—46% compared to 12% for non-orphan products.
The number of indications for a lead product also influences risk and reward. Multi-indication assets yield higher investment multiples and annualized returns than single-indication drugs. Molecule type matters as well; biologics and gene therapies command higher valuations at early stages, while small molecules may deliver superior returns in specific phases. Disease area further shapes risk, with oncology and central nervous system products generating higher shareholder returns despite similar valuation levels.
Clinical/Scientific Factor | Key Findings on Equity Valuation and Returns |
|---|---|
Development Stage | Early stages carry higher risk and uncertainty, but offer higher potential returns. |
Orphan Designation | Orphan products show higher late-stage valuations and annual returns. |
Number of Indications | Multi-indication products yield higher investment multiples and returns. |
Molecule Type | Biologics/gene therapies valued higher early; small molecules excel in certain phases. |
Disease Area | Oncology and CNS products yield higher shareholder returns. |
Understanding these clinical and scientific risk factors enables investors to assess the likelihood of success and the potential for value creation across a company’s pipeline.
Market Adoption Risks and Pipeline Valuation
Market adoption risk remains a critical consideration for pharmaceutical investors evaluating pipeline valuation. Despite robust clinical data and regulatory approval, many new products struggle to achieve commercial success. Between 2009 and 2017, 40% of new prescription medications failed to meet their two-year sales forecasts. This high rate of underperformance highlights the persistent risk associated with market adoption.
Several factors contribute to market adoption risk:
Payer activation and reimbursement challenges
Regulatory obstacles that delay or restrict market entry
Limited adoption by healthcare professionals due to unfamiliarity or lack of differentiation
Inefficiencies in sales force execution
Patient engagement difficulties
Shortened product life cycles further compress the revenue window, while difficulty in differentiating products often leads to price competition and increased risk. Regulatory and policy changes can directly affect product sales, and declining sales force effectiveness hampers relationship building with key customers. Increased R&D investment, while essential for innovation, raises financial risk if products fail to gain traction.
Biosimilars and medical devices illustrate these risks vividly. Patent litigation and physician unfamiliarity slow biosimilar adoption, with over half of oncologists unfamiliar and 30% unwilling to prescribe them to new patients. Medical devices face slow uptake due to high costs, delayed reimbursement, and physician reluctance to switch without clear clinical benefits. For example, innovative cardiovascular devices saw average price increases of 273.3% over previous models, creating financial barriers. Delays in reimbursement coding—averaging six months post-FDA approval—further hinder adoption.
Companies that anticipate and address market adoption risk through strategic planning, education, and payer engagement position themselves for stronger pipeline valuation and long-term success.
Reflective Takeaway:
Risk assessment in equity analysis demands a holistic view of regulatory, clinical, scientific, and market adoption risks. Investors who develop a nuanced understanding of these risk factors can better evaluate the resilience and growth potential of pharmaceutical companies. In a sector defined by uncertainty and innovation, thoughtful risk analysis remains the cornerstone of sound investment decisions.
Financial and Operational Risks in Mid-cap Pharmaceutical Companies
Mid-cap pharmaceutical companies face a unique blend of financial and operational risks that shape their long-term prospects. These organizations often operate in a dynamic environment where access to capital, pipeline diversity, and operational agility determine resilience. Investors and analysts closely monitor several measurable indicators to assess the risk profile of these companies.
A review of recent data reveals that stock performance serves as a surrogate for company success, with outcomes ranging from strong gains to significant losses. The fate of mid-cap pharmaceutical companies post-IPO varies: a majority remain active, while others experience acquisition, merger, or bankruptcy. Companies with a greater number of drug development programs—especially those with five or more—tend to outperform peers, highlighting the importance of pipeline diversity. Headquarters location also plays a role; firms based in California or Massachusetts often report better operational outcomes, particularly in oncology. Academic funding above $100,000 correlates with improved stock performance, suggesting that collaboration with research institutions can help mitigate risk.
Risk Data Point | Description / Association |
|---|---|
Stock Performance | Good (≥ +25%), mediocre (±25%), or poor (≤ -25%)—reflects company success |
IPO Outcomes | Active (59.5%), Acquired (19.3%), Merged (11.3%), Bankrupt (5.4%), Others (4.8%) |
Number of Drug Programs | 1, 2-4, or ≥5; more programs link to better performance |
Pipeline Diversity | Broader pipelines, especially in oncology, trend toward stronger results |
Headquarters Location | California/Massachusetts HQs linked to better outcomes |
Academic Funding | ≥ $100,000 improves stock performance |
Operational risk extends beyond internal factors. The Economist Intelligence Unit provides standardized risk scores across 180 countries and 26 sectors, including pharmaceutical companies. These scores cover ten operational risk categories and seventy subcategories, enabling mid-cap pharmaceutical companies to anticipate and address macro-level threats such as regulatory shifts, supply chain disruptions, and geopolitical instability. Integrating these risk models into company strategy supports more robust decision-making.
Mid-cap pharmaceutical companies that proactively manage financial and operational risk position themselves for sustainable growth. They diversify pipelines, foster academic partnerships, and leverage data-driven risk models. This approach not only protects value but also creates a foundation for innovation and adaptability in a rapidly evolving sector.
Reflective Takeaway:
A thoughtful approach to risk management empowers mid-cap pharmaceutical companies to navigate uncertainty with confidence. By understanding and addressing both financial and operational risks, these organizations can transform challenges into opportunities for strategic growth and long-term resilience.
Strategic Value Drivers for Investors
Mergers and Acquisitions (M&A) Potential in Pharmaceutical Companies
Mergers and acquisitions shape the landscape of biotech valuation and drive significant value creation across the pharmaceutical sector. Companies pursue mega-mergers to diversify portfolios and address looming patent expirations, as seen in AbbVie’s $63 billion acquisition of Allergan and Bristol-Myers Squibb’s $74 billion purchase of Celgene. Strategic acquisitions of biotech firms provide access to innovative drug candidates, accelerating development and enhancing value through milestone payments and royalties. Divestments and spin-offs, such as Johnson & Johnson’s separation of Kenvue and GSK’s creation of Haleon, unlock shareholder value and sharpen focus on high-growth pharmaceutical businesses. Emerging markets in Asia and Latin America attract attention, with Takeda’s $62 billion acquisition of Shire plc highlighting the global reach of value-driven deals. Regulatory changes, including FDA accelerated approval pathways, shorten development timelines and increase the appeal of M&A for both established companies and smaller biotech firms seeking funding lifelines.
Mega-mergers diversify portfolios and address patent cliffs.
Strategic biotech acquisitions accelerate innovation and value realization.
Spin-offs and divestments unlock hidden value and sharpen business focus.
Expansion into emerging markets broadens growth opportunities.
Regulatory shifts and expedited pathways enhance M&A attractiveness.
Trends in personalized medicine and AI integration drive both large and targeted acquisitions.
In Q1 2025, pharmaceutical M&A deal value surged by 101% quarter-over-quarter, despite political turbulence in the US. Notable transactions included Johnson & Johnson’s $14.6 billion acquisition of Intra-Cellular Therapies and Novartis’ $3.1 billion purchase of Anthos Therapeutics. Oncology remains the leading therapeutic area, reflecting a persistent focus on high-growth segments and the pursuit of value through innovation.
Innovation, Intellectual Property, and Pipeline Valuation
Innovation and intellectual property stand at the core of biotech valuation, directly influencing the value of both established and emerging companies. The risk-adjusted net present value (rNPV) method dominates pharmaceutical valuation, as it incorporates the probability of success at each clinical stage and adjusts projected cash flows accordingly. This approach captures the high attrition rates in drug development and provides a realistic assessment of value, especially for assets progressing through clinical milestones. Strong patent portfolios with broad geographic coverage offer competitive advantages and support premium pricing, while active patent lifecycle management sustains value against challenges. Technology platforms that enable multiple product developments add versatility, often leading to higher valuation and greater value realization.
Intellectual property metrics include patent strength, duration, and lifecycle management.
Innovation metrics focus on pipeline quality, scientific novelty, and candidate distribution across development stages.
Orphan drug designation and extended exclusivity periods enhance value by providing longer revenue windows.
Pre-revenue biotech companies rely on risk-adjusted methodologies for valuation, emphasizing pipeline potential over traditional cash flow.
Scenario and sensitivity analyses address uncertainties in emerging modalities like cell and gene therapies.
Metric/Factor | Impact on Value and Biotech Valuation |
|---|---|
Patent strength & coverage | Sustains premium pricing and competitive advantage |
Pipeline innovation | Drives higher valuation and market differentiation |
rNPV methodology | Reflects risk, stage progression, and true value |
Orphan drug exclusivity | Extends revenue window and boosts valuation |
Products addressing high unmet medical needs typically command premium valuations, reinforcing the importance of innovation and intellectual property in driving value.
Strategic Partnerships and Alliances for Investors
Strategic partnerships and alliances serve as powerful engines of value in the biotech and pharmaceutical sectors. Alignment of objectives between partners ensures shared goals, while trust and transparency foster strong collaboration. Clear communication channels and effective governance structures, including dedicated alliance managers, maintain focus and accountability. Intellectual property management remains critical, protecting innovations and sustaining value throughout the partnership lifecycle. Companies must proactively address challenges such as cultural differences and potential IP disputes to maximize alliance success.
Metric/Outcome | Description/Impact |
|---|---|
Innovation Cycle Reduction | 15% reduction in development time within the first year, accelerating value realization. |
Cost Efficiency Improvement | 10% reduction in R&D expenditure, increasing value for stakeholders. |
Market Penetration Acceleration | 20-25% annual increase in market share due to faster commercialization. |
Revenue Growth | Up to 30% increase in revenue attributed to successful alliances and new product launches. |
Case Study: Pfizer-BioNTech | Collaboration accelerated COVID-19 vaccine development, showcasing rapid value creation. |
Case Study: Eli Lilly-Incyte | Alliance led to multiple immunology drugs and significant revenue growth, highlighting partnership value. |
Recent M&A case studies reveal that prior strategic alliances between acquirers and targets can improve deal outcomes. These alliances reduce information asymmetries, build trust, and enhance transaction efficiency. Although less than 2.6% of alliances transition into M&A, those that do often achieve faster deal completion and higher announcement returns. Companies with alliance experience tend to realize better integration and financial performance post-merger, further amplifying value for all stakeholders.
Reflective Takeaway:
Strategic value drivers—M&A, innovation, intellectual property, and alliances—define the future of biotech valuation and pharmaceutical success. Companies that master these levers unlock new value, adapt to evolving markets, and sustain leadership in a dynamic industry. For those seeking enduring opportunity, understanding these drivers offers a roadmap to lasting value and growth.
Management Team and Track Record in Equity Analysis
A pharmaceutical company’s management team often shapes its destiny as much as its scientific pipeline. Investors scrutinize the leadership’s experience, decision-making style, and ability to execute complex strategies. A strong track record in navigating regulatory challenges, launching new products, and building partnerships signals resilience and adaptability—qualities that drive long-term value.
Leading organizations now recognize that operationalizing gender inclusion within management ranks and across clinical development teams enhances both performance and trust. Companies set benchmarks for sex representation in clinical trials and analyze data by gender to ensure results apply broadly. Inclusive hiring and promotion practices, tied to clear performance indicators and incentives, have become standard for top-performing firms. These efforts do not remain isolated within human resources; instead, they integrate into strategic planning and receive oversight at the board level. Transparent reporting and accountability frameworks reinforce these standards, making inclusion a measurable part of company culture.
Management Metric | Impact on Equity Analysis |
|---|---|
Gender-Inclusive Leadership | Improves stakeholder trust and scientific rigor |
Transparent Reporting | Enhances accountability and investor confidence |
Board-Level Oversight | Integrates inclusion into strategic planning |
Companies that embrace these practices often see improved scientific rigor, stronger stakeholder relationships, and more robust long-term performance. Conversely, neglecting such metrics can lead to regulatory setbacks, loss of patient loyalty, and diminished innovation. Investors increasingly view management’s commitment to inclusion and transparency as a proxy for broader operational excellence.
A management team’s track record also includes its ability to respond to setbacks, adapt to changing market conditions, and foster a culture of innovation. The table below highlights key attributes investors evaluate when assessing leadership quality:
Attribute | Why It Matters |
|---|---|
Regulatory Experience | Reduces risk of approval delays |
Product Launch Success | Signals commercial acumen |
Strategic Partnerships | Expands market reach and expertise |
Inclusion Initiatives | Drives innovation and trust |
A thoughtful approach to leadership assessment reveals more than resumes or quarterly results. It uncovers the values and systems that sustain growth, resilience, and trust—qualities that set enduring companies apart in the ever-evolving world of pharmaceuticals.
A comprehensive approach that blends key indicators with advanced analytics enables investors to unlock greater value in pharmaceutical and biotech companies.
AI-driven platforms and predictive analytics quantify news impact, forecast development success, and optimize portfolio value.
Strategic partnerships and real-world evidence monitoring further enhance decision-making and long-term value.
Valuation Method | Benefit for Investors | Value Contribution |
|---|---|---|
Captures dynamic risk and potential returns | Increases accuracy of value assessment | |
Real Options Valuation | Models flexibility in uncertain environments | Supports strategic value realization |
By applying these key indicators, investors can identify opportunities, manage risk, and realize sustained value. This practical framework transforms complex analysis into actionable insights, guiding smarter decisions and fostering enduring value in a rapidly evolving sector.
FAQ
What makes equity analysis unique in the pharmaceutical and biotech sectors?
Equity analysis in these sectors requires a deep understanding of clinical development, regulatory milestones, and pipeline valuation. Investors must evaluate scientific risk, market adoption, and financial health. This approach differs from traditional industries, where product cycles and regulatory hurdles are less complex.
How do clinical trial success rates influence company valuation?
Clinical trial success rates directly impact the probability of a drug reaching the market. Higher success rates increase a company’s risk-adjusted net present value (rNPV). Investors often use these rates to estimate future revenue and assess the likelihood of commercial success.
Why does patent life matter for pharmaceutical companies?
Patent life determines how long a company can exclusively market a drug. Longer exclusivity protects revenue streams and delays generic competition. This period allows companies to recoup research investments and fund future innovation, making it a critical factor in equity analysis.
Which financial ratios are most important for biotech investors?
Key ratios include price-to-earnings (P/E), enterprise value-to-sales (EV/Sales), and debt-to-equity. These metrics help investors assess profitability, valuation, and financial risk. The table below summarizes their significance:
Ratio | What It Shows | Why It Matters |
|---|---|---|
P/E | Profitability | Indicates earnings power |
EV/Sales | Valuation vs. revenue | Useful for early-stage |
Debt-to-Equity | Leverage | Reveals financial risk |
How do strategic partnerships drive value in biotech?
Strategic partnerships provide access to new technologies, expertise, and markets. They reduce development risk and accelerate innovation. Successful alliances often lead to faster product launches and stronger financial performance. The table below highlights key partnership benefits:
Benefit | Impact on Company |
|---|---|
Shared expertise | Faster innovation |
Risk reduction | Greater resilience |
Market access | Expanded reach |
Thoughtful equity analysis blends financial insight with scientific understanding. Investors who consider both innovation and risk position themselves to recognize enduring value in a rapidly changing industry.
Essential Equity Analysis Indicators for Pharma & Biotech Investors
When it comes to navigating the path to long-term financial success, it helps to have a steady hand guiding you through the twists and turns of the markets, and that’s exactly the approach we take at VASRO. Rather than chasing every headline, we focus on the signals that truly matter: robust revenue trajectories, disciplined cash-flow management, and the subtle shifts in market sentiment that reveal hidden opportunities. By combining deep equity analysis with real-time market intelligence, we help you build a portfolio designed to grow steadily over time, even when volatility threatens to throw you off course. Think of us as your trusted co-pilot, offering clear insights and precise strategies so you can stay the course, compound your gains, and turn the journey toward wealth creation into a confidence-building adventure rather than a leap of faith.
Disclaimer: The information provided on www.vasro.de is for general informational purposes only and does not constitute investment advice or a recommendation to invest in any particular asset or market. VASRO GmbH does not offer personalized investment advice, and the content on this website should not be relied upon as such. Visitors are encouraged to seek independent financial advice tailored to their specific circumstances before making any investment decisions. VASRO GmbH disclaims any liability for investment decisions made based on the information presented on this website.